Using Boxplots
[1]:
import transportation_tutorials as tt
import pandas as pd
import numpy as np
import matplotlib.pyplot as plt
Questions
- Use a boxplot to show the distribution of household income in the Jupiter study area, by number of automobiles owned. What is the median income of households who own exactly two automobiles? (Hint: the correct answer is $96 thousand.)
- Is the median income higher or lower if we only consider two-car households that have at least one person over age 65? Create a set of box plots similar to those created in question (1), but only for households with at least one person over age 65.
Data
To answer the questions, use the following data files:
[2]:
hh = pd.read_csv(tt.data('SERPM8-BASE2015-HOUSEHOLDS'))
hh.head()
[2]:
| Unnamed: 0 | hh_id | home_mgra | income | autos | transponder | cdap_pattern | jtf_choice | autotech | tncmemb | |
|---|---|---|---|---|---|---|---|---|---|---|
| 0 | 426629 | 1690841 | 7736 | 512000 | 2 | 1 | MMMM0 | 0 | 0 | 0 |
| 1 | 426630 | 1690961 | 7736 | 27500 | 1 | 0 | MNMM0 | 0 | 0 | 0 |
| 2 | 426631 | 1690866 | 7736 | 150000 | 2 | 0 | HMM0 | 0 | 0 | 0 |
| 3 | 426632 | 1690895 | 7736 | 104000 | 2 | 1 | MMMM0 | 0 | 0 | 0 |
| 4 | 426633 | 1690933 | 7736 | 95000 | 2 | 1 | MNM0 | 0 | 0 | 0 |
[3]:
person = pd.read_csv(tt.data('SERPM8-BASE2015-PERSONS'))
person.head()
[3]:
| hh_id | person_id | person_num | age | gender | type | value_of_time | activity_pattern | imf_choice | inmf_choice | fp_choice | reimb_pct | wrkr_type | |
|---|---|---|---|---|---|---|---|---|---|---|---|---|---|
| 0 | 1690841 | 4502948 | 1 | 46 | m | Full-time worker | 5.072472 | M | 1 | 1 | -1 | 0.0 | 0 |
| 1 | 1690841 | 4502949 | 2 | 47 | f | Part-time worker | 5.072472 | M | 2 | 37 | -1 | 0.0 | 0 |
| 2 | 1690841 | 4502950 | 3 | 11 | f | Student of non-driving age | 3.381665 | M | 3 | 1 | -1 | 0.0 | 0 |
| 3 | 1690841 | 4502951 | 4 | 8 | m | Student of non-driving age | 3.381665 | M | 3 | 1 | -1 | 0.0 | 0 |
| 4 | 1690961 | 4503286 | 1 | 52 | m | Part-time worker | 2.447870 | M | 1 | 2 | -1 | 0.0 | 0 |
Solution
To answer the first question, we create a boxplot using two columns in hh dataframe : income and autos. But before that, let’s filter the records to remove those where incomes are reported as zero or unavailable.
[4]:
hh = hh[(hh.income > 0) & (hh.income != 0)]
The we can draw the boxplot.
[5]:
hh_box_1 = list(hh.groupby('autos').income)
plt.boxplot(
    [i[1] for i in hh_box_1],
    vert = False,
    labels = [i[0] for i in hh_box_1],
    notch = True,
    widths = 0.6,
);
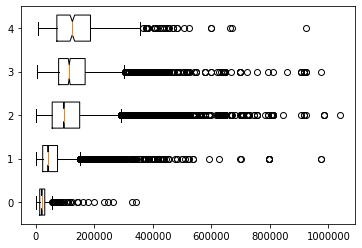
This is a bit hard to read, as the long tails of very high income households are filling up the figure. We can fix this by clipping the x-axis range, and we can also add some labels to explain what we’re looking at.
[6]:
plt.boxplot(
    [i[1] for i in hh_box_1],
    vert = False,
    labels = [i[0] for i in hh_box_1],
    notch = True,
    widths = 0.6,
)
plt.xlim(-10000, 200000)
plt.title('Household Income by Number of Autos')
plt.xlabel('Household Income')
plt.ylabel('Autos');
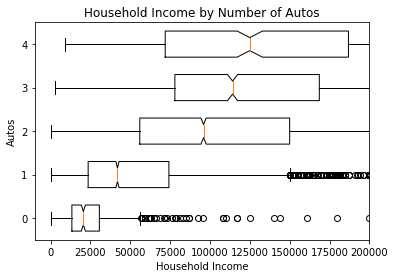
From this figure, we can more clearly see the median income of households with 2 autos is slightly lower than $100,000. The actual value of $96,000 can be found more exactly using the median function.
[7]:
np.median(hh[hh.autos == 2].income)
[7]:
96000.0
Now, let’s move on to the second question. First, we use person dataframe to calculate total maximum age for each household using the .groupby() method.
[8]:
max_age = person.groupby(['hh_id'])['age'].max().rename('max_age')
Then, we merge the ages with household information to obtain our final dataset and perform some basic filtering to satisfy the conditions.
[9]:
hh_2 = pd.merge(hh, max_age, on='hh_id', how='left')
hh_2 = hh_2[(hh_2.max_age > 65) & (hh_2.income > 0)]
[10]:
hh_2.head()
[10]:
| Unnamed: 0 | hh_id | home_mgra | income | autos | transponder | cdap_pattern | jtf_choice | autotech | tncmemb | max_age | |
|---|---|---|---|---|---|---|---|---|---|---|---|
| 9 | 426638 | 1690921 | 7736 | 329000 | 2 | 0 | NN0 | 0 | 0 | 0 | 84 |
| 12 | 426641 | 1690904 | 7736 | 169750 | 2 | 1 | MM0 | 0 | 0 | 0 | 66 |
| 20 | 426649 | 1690940 | 7736 | 22300 | 1 | 0 | MHM0 | 0 | 0 | 0 | 68 |
| 21 | 426650 | 1690965 | 7736 | 427400 | 3 | 1 | NMj | 13 | 0 | 0 | 74 |
| 28 | 426657 | 1691054 | 7737 | 289000 | 3 | 1 | NNj | 4 | 0 | 0 | 67 |
We are now ready to prepare the boxplot and find the answer.
[11]:
hh_box_2 = list(hh_2.groupby('autos').income)
plt.boxplot(
    [i[1] for i in hh_box_2],
    vert = False,
    labels = [str(i[0])+"*" for i in hh_box_2],
    notch = True,
    widths = 0.6,
)
plt.xlim(-10000,200000)
plt.title('Household Income by Number of Autos')
plt.xlabel('Household Income')
plt.ylabel('Autos');
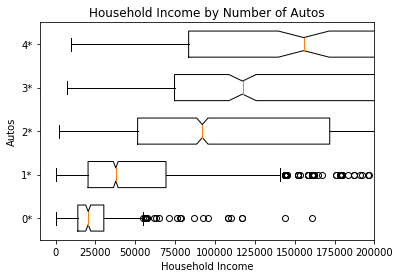
The median income of households who have 2 cars and have a person over 65 is less than for all households with 2 cars. The exact value can be confirmed numerically:
[12]:
hh_2[hh_2.autos == 2].income.median()
[12]:
92100.0
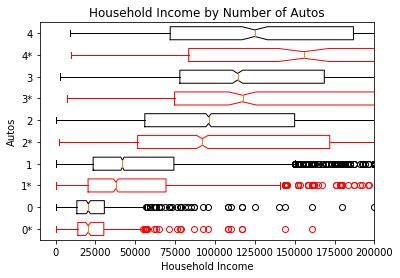
While more complicated to draw, iterleaving both sets of boxplots in the same plot makes comparisons between the full population and the set of households with at least one person over 65 even easier to see:
[13]:
plt.boxplot(
    [i[1] for i in hh_box_1],
    vert = False,
    labels = [i[0] for i in hh_box_1],
    notch = True,
    widths = 0.6,
    positions = range(2, (len(hh_box_2))*2+2, 2),
)

hh_box_2 = list(hh_2.groupby('autos').income)
plt.boxplot(
    [i[1] for i in hh_box_2],
    vert = False,
    labels = [str(i[0])+"*" for i in hh_box_2],
    notch = True,
    widths = 0.6,
    positions = range(1, (len(hh_box_2))*2+1, 2),
    boxprops=dict(color="red"),
    whiskerprops=dict(color="red"),
    capprops=dict(color="red"),
    flierprops=dict(markeredgecolor="red"),
)
plt.xlim(-10000,200000)
plt.title('Household Income by Number of Autos')
plt.xlabel('Household Income')
plt.ylabel('Autos');