Using Dynamic Mapping
[1]:
import transportation_tutorials as tt
import geopandas as gpd
import pandas as pd
import matplotlib.pyplot as plt
import folium
from shapely.geometry import Polygon
Questions
Using folium, create a dynamic map and place markers on the centroids of the five MAZ’s with the highest population density MAZs. Use popup text on markers to show population density and total employment information for each of those MAZs. By clicking the markers, you should be able to answer the following questions:
- Where is the highest population density?
- What is the total employment in the MAZ that has the highest population density?
Data
To answer the questions, use the following files:
[2]:
maz = gpd.read_file(tt.data('SERPM8-MAZSHAPE'))
maz_data = pd.read_csv(tt.data('SERPM8-MAZDATA', '*.csv'))
[3]:
maz.head()
[3]:
| OBJECTID | MAZ | SHAPE_LENG | SHAPE_AREA | ACRES | POINT_X | POINT_Y | geometry | |
|---|---|---|---|---|---|---|---|---|
| 0 | 1 | 5347 | 8589.393674 | 3.111034e+06 | 71 | 953130 | 724165 | POLYGON ((953970.4660769962 723936.0810402408,... |
| 1 | 2 | 5348 | 11974.067469 | 7.628753e+06 | 175 | 907018 | 634551 | POLYGON ((908505.2801046632 635081.7738410756,... |
| 2 | 3 | 5349 | 9446.131753 | 4.007041e+06 | 92 | 923725 | 707062 | POLYGON ((922736.6374686621 708387.6918614879,... |
| 3 | 4 | 5350 | 21773.153739 | 2.487397e+07 | 571 | 908988 | 713484 | POLYGON ((908334.2374677472 715692.2628822401,... |
| 4 | 5 | 5351 | 17882.701416 | 1.963139e+07 | 451 | 909221 | 717493 | POLYGON ((911883.0187559947 719309.3261861578,... |
[4]:
#maz = maz.to_crs(epsg = 4326)
[5]:
maz.crs
[5]:
{'init': 'epsg:2236'}
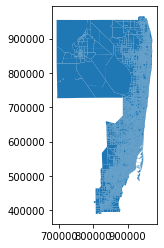
[6]:
maz.plot()
[6]:
<matplotlib.axes._subplots.AxesSubplot at 0x1a28780a20>
[7]:
maz_data.head()
[7]:
| mgra | TAZ | HH | POP | emp_self | emp_ag | emp_const_non_bldg_prod | emp_const_non_bldg_office | emp_utilities_prod | emp_utilities_office | ... | EmpDenBin | DuDenBin | POINT_X | POINT_Y | ACRES | HotelRoomTotal | mall_flag | beachAcres | geoSRate | geoSRateNm | |
|---|---|---|---|---|---|---|---|---|---|---|---|---|---|---|---|---|---|---|---|---|---|
| 0 | 1 | 2901 | 43 | 169 | 0 | 0 | 0 | 0 | 0 | 0 | ... | 1 | 1 | 841743 | 586817 | 510 | 0 | 0 | 0 | 1 | 1 |
| 1 | 2 | 2902 | 9 | 21 | 0 | 1 | 1006 | 0 | 8 | 0 | ... | 1 | 1 | 855391 | 585688 | 5678 | 0 | 0 | 0 | 1 | 1 |
| 2 | 3 | 2903 | 403 | 1389 | 0 | 0 | 6 | 0 | 0 | 0 | ... | 1 | 1 | 858417 | 549492 | 85 | 0 | 0 | 0 | 1 | 1 |
| 3 | 4 | 2903 | 477 | 1659 | 0 | 0 | 3 | 0 | 0 | 0 | ... | 1 | 1 | 858468 | 552269 | 103 | 0 | 0 | 0 | 1 | 1 |
| 4 | 5 | 2903 | 374 | 1389 | 0 | 0 | 11 | 0 | 0 | 0 | ... | 1 | 1 | 859899 | 552161 | 72 | 0 | 0 | 0 | 1 | 1 |
5 rows × 76 columns
Solution
First, we will merge maz_data dataframe with maz geo-dataframe to get a single dataframe with required geographic and demographic information together. After merging, we select top 5 highly populated MAZs.
[8]:
maz_data = maz_data[['mgra', 'POP', 'PopDen', 'emp_total']]
[9]:
# maz_data = maz_data.astype(float)
[10]:
maz = maz.merge(maz_data, how = 'left', left_on = 'MAZ', right_on = 'mgra')
[11]:
maz['ExactPopDen'] = maz['POP'] / maz.area * 5280**2
[12]:
maz = maz.sort_values(by = 'ExactPopDen', ascending = False).head(5)
Then, we prepare the geographic information for dynamic mapping. We convert the CRS format of coordinates of MAZ centroids to input them in folium, the mapping package that we are going to use. We will use pyproj for this purpose.
[18]:
from pyproj import Proj, transform
input_Proj  = Proj("+init=EPSG:2236",preserve_units=True)
output_Proj = Proj("+init=EPSG:4326")

point_x = []
point_y = []

for index, row in maz.iterrows():

    coor = transform(input_Proj,output_Proj,row.POINT_X, row.POINT_Y)
    point_x.append(coor[0])
    point_y.append(coor[1])

maz['POINT_X_'] = point_x
maz['POINT_Y_'] = point_y
[19]:
maz
[19]:
| OBJECTID | MAZ | SHAPE_LENG | SHAPE_AREA | ACRES | POINT_X | POINT_Y | geometry | mgra | POP | PopDen | emp_total | ExactPopDen | POINT_X_ | POINT_Y_ | |
|---|---|---|---|---|---|---|---|---|---|---|---|---|---|---|---|
| 8719 | 8720 | 2043 | 1118.734044 | 73775.530919 | 2 | 923754 | 523748 | POLYGON ((923616.3597905785 523581.4791255742,... | 2043 | 1271 | 33.70 | 2127 | 480287.243731 | -80.186882 | 25.772271 |
| 7439 | 7440 | 763 | 4598.270892 | 96146.266956 | 2 | 932171 | 571467 | POLYGON ((932668.741948247 572438.5365949869, ... | 763 | 869 | 16.03 | 0 | 251973.689328 | -80.160381 | 25.903407 |
| 8753 | 8754 | 2077 | 2213.840968 | 284133.182991 | 7 | 922641 | 521139 | POLYGON ((922916.4012167454 521429.7248989046,... | 2077 | 1508 | 52.82 | 1040 | 147960.990538 | -80.190312 | 25.765112 |
| 8640 | 8641 | 1964 | 2578.656554 | 344555.061769 | 8 | 923398 | 531247 | POLYGON ((923850.8084686622 531288.7324118242,... | 1964 | 1755 | 25.74 | 62 | 141999.341843 | -80.187823 | 25.792908 |
| 8642 | 8643 | 1966 | 2030.071693 | 247320.734972 | 6 | 923906 | 530650 | POLYGON ((924173.7717334963 530376.9533954933,... | 1966 | 1118 | 22.44 | 978 | 126022.798709 | -80.186290 | 25.791257 |
Now, we create a map with a suitable starting location and zoom level. Then, we plot the markers with necessary popup text.
[20]:
maz_map = folium.Map(location = [maz.POINT_Y_.mean(), maz.POINT_X_.mean()], tiles = 'Stamen Toner', zoom_start = 9)
[32]:
for index, row in maz.iterrows():
    popup = 'PopDen:{}, EMP:{}, ExactPopDen:{:,.0f}'.format(row.PopDen, row.emp_total, row.ExactPopDen)
    folium.Marker([row.POINT_Y_, row.POINT_X_], popup = popup, tooltip = 'MAZ ID:{}'.format(row.MAZ)).add_to(maz_map)
[33]:
maz_map
[33]: