Using Heatmaps
[1]:
import transportation_tutorials as tt
import pandas as pd
import numpy as np
import matplotlib.pyplot as plt
import seaborn as sns
pd.options.display.max_columns = 100
Questions
Prepare a heatmap that visualizes the joint distribution of the number of trips taken by each household and the number of automobiles owned by the household.
- For households with 2 automobiles, what is the most frequent number of trips made by those households in the data?
- For households making 2 trips in the data, how many automobiles do most households own?
Data
To answer the questions, use the following data files:
[2]:
trip = pd.read_csv(tt.data('SERPM8-BASE2015-TRIPS'))
trip.head()
[2]:
| hh_id | person_id | person_num | tour_id | stop_id | inbound | tour_purpose | orig_purpose | dest_purpose | orig_mgra | dest_mgra | parking_mgra | stop_period | trip_mode | trip_board_tap | trip_alight_tap | tour_mode | smplRate_geo | autotech | tncmemb | |
|---|---|---|---|---|---|---|---|---|---|---|---|---|---|---|---|---|---|---|---|---|
| 0 | 1690841 | 4502948 | 1 | 0 | -1 | 0 | Work | Home | Work | 7736 | 9290 | -1 | 8 | 6 | 0 | 0 | 6 | 1.0 | 0 | 0 |
| 1 | 1690841 | 4502948 | 1 | 0 | -1 | 1 | Work | Work | Home | 9290 | 7736 | 0 | 29 | 3 | 0 | 0 | 6 | 1.0 | 0 | 0 |
| 2 | 1690841 | 4502948 | 1 | 1 | -1 | 0 | Work-Based | Work | Work-Based | 9290 | 7980 | -1 | 13 | 1 | 0 | 0 | 1 | 1.0 | 0 | 0 |
| 3 | 1690841 | 4502948 | 1 | 1 | -1 | 1 | Work-Based | Work-Based | Work | 7980 | 9290 | -1 | 14 | 1 | 0 | 0 | 1 | 1.0 | 0 | 0 |
| 4 | 1690841 | 4502948 | 1 | 2 | -1 | 0 | Work-Based | Work | Work-Based | 9290 | 10608 | -1 | 19 | 3 | 0 | 0 | 3 | 1.0 | 0 | 0 |
[3]:
hh = pd.read_csv(tt.data('SERPM8-BASE2015-HOUSEHOLDS'))
hh.head()
[3]:
| Unnamed: 0 | hh_id | home_mgra | income | autos | transponder | cdap_pattern | jtf_choice | autotech | tncmemb | |
|---|---|---|---|---|---|---|---|---|---|---|
| 0 | 426629 | 1690841 | 7736 | 512000 | 2 | 1 | MMMM0 | 0 | 0 | 0 |
| 1 | 426630 | 1690961 | 7736 | 27500 | 1 | 0 | MNMM0 | 0 | 0 | 0 |
| 2 | 426631 | 1690866 | 7736 | 150000 | 2 | 0 | HMM0 | 0 | 0 | 0 |
| 3 | 426632 | 1690895 | 7736 | 104000 | 2 | 1 | MMMM0 | 0 | 0 | 0 |
| 4 | 426633 | 1690933 | 7736 | 95000 | 2 | 1 | MNM0 | 0 | 0 | 0 |
Solution
To find the number of trips that each household makes, we can create a dummy column with value 1 and use .groupby() method to count the total number of trips for each household. Then, we merge this information with household information to get the final dataframe.
[4]:
hh_trip_count = trip.groupby(['hh_id']).size().rename('trip_count')
[5]:
hh_trip_count.head()
[5]:
hh_id
1690841    20
1690851    12
1690853     8
1690856    23
1690858     5
Name: trip_count, dtype: int64
[6]:
data = pd.merge(hh_trip_count, hh, on = 'hh_id', how = 'left')
[7]:
data.head()
[7]:
| hh_id | trip_count | Unnamed: 0 | home_mgra | income | autos | transponder | cdap_pattern | jtf_choice | autotech | tncmemb | |
|---|---|---|---|---|---|---|---|---|---|---|---|
| 0 | 1690841 | 20 | 426629 | 7736 | 512000 | 2 | 1 | MMMM0 | 0 | 0 | 0 |
| 1 | 1690851 | 12 | 426645 | 7736 | 68200 | 4 | 1 | HNM0 | 0 | 0 | 0 |
| 2 | 1690853 | 8 | 426643 | 7736 | 127000 | 2 | 0 | MMMH0 | 0 | 0 | 0 |
| 3 | 1690856 | 23 | 426642 | 7736 | 59500 | 4 | 1 | MNMMMM0 | 0 | 0 | 0 |
| 4 | 1690858 | 5 | 426640 | 7736 | 200030 | 1 | 0 | M0 | 0 | 0 | 0 |
[8]:
data.info()
<class 'pandas.core.frame.DataFrame'>
Int64Index: 17260 entries, 0 to 17259
Data columns (total 11 columns):
hh_id           17260 non-null int64
trip_count      17260 non-null int64
Unnamed: 0      17260 non-null int64
home_mgra       17260 non-null int64
income          17260 non-null int64
autos           17260 non-null int64
transponder     17260 non-null int64
cdap_pattern    17260 non-null object
jtf_choice      17260 non-null int64
autotech        17260 non-null int64
tncmemb         17260 non-null int64
dtypes: int64(10), object(1)
memory usage: 1.6+ MB
Then we create a pivot table using autos and trip_count columns in the dataframe as index and columns in .pivot_table() method. We use aggfunc = 'size' to get the count of households in this two-dimensional table.
[9]:
data_pivot = data.pivot_table(index = 'autos', columns = 'trip_count', aggfunc = 'size')
Finally, we create a heatmap using seaborn package. We can adjust the height and width of the heatmap using plt.figure(figsize = (width, height)). Please make sure to specify the figure size before creating heatmap.
We can set annot = True in sns.heatmap() to get the numbers visible in the plot. Also, there are some other arguments that we can specify to get the heatmap in desirable format.
[10]:
plt.figure(figsize = (25, 3))
ax = sns.heatmap(data_pivot.fillna(0), annot = True, fmt = ",.0f", linewidths=.5, cmap = 'OrRd')
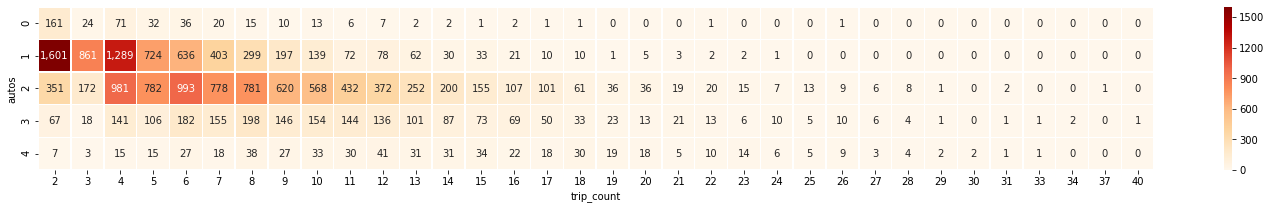
From the heatmap that we just created, we can easily find answers looking at the numbers as well as color map.
For households with 2 automobiles, 6 is the most common number of trips per day, although 4 trips is a close runner-up.
For households making only 2 trips in a day, the vast majority of them have 1 automobile.